温哥华市中心餐厅及酒吧出售MLS#C8075822
1256 Robson St, Vancouver, BC V6E 1C2 地图周边 | 社区结构
物件说明
- iU91编号 127951
- 发布人 地产经纪
特色说明
餐厅及酒吧位于温哥华市中心最繁忙、最具商业价值的 Robson 街核心地段,周边汇聚大量本地居民、办公人群及国际游客,全年客流稳定且消费能力强,是市中心极为稀缺的优质餐饮铺位。物业配备完整的商业厨房设备,可满足多种餐饮形式的日常运营需求,接手后可快速投入经营,降低前期投入成本与筹备时间。室内空间宽敞,座位数量充足,布局灵活,既适合日常堂食,也可承接团体聚会、商务宴请及活动包场等多元化经营模式。同时,该铺位在业态上具备较高灵活性,可根据经营者的理念与市场需求改造为不同类型的餐厅或餐饮概念,为自营或投资型买家提供了极具吸引力的发展潜力和想象空间。
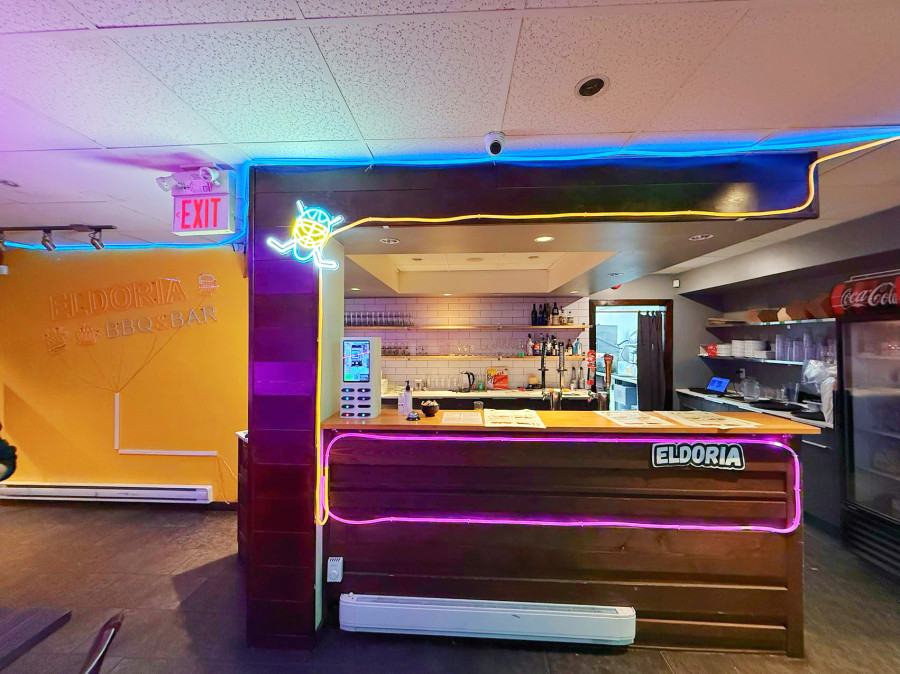
Prime restaurant and bar opportunity located on the highly sought-after Robson Street in the heart of Downtown Vancouver, one of the city’s busiest and most valuable commercial corridors. Surrounded by a strong mix of local residents, office users, and international visitors, the area enjoys consistent year-round foot traffic with solid spending power, making this a rare and highly desirable food and beverage location in the downtown core.
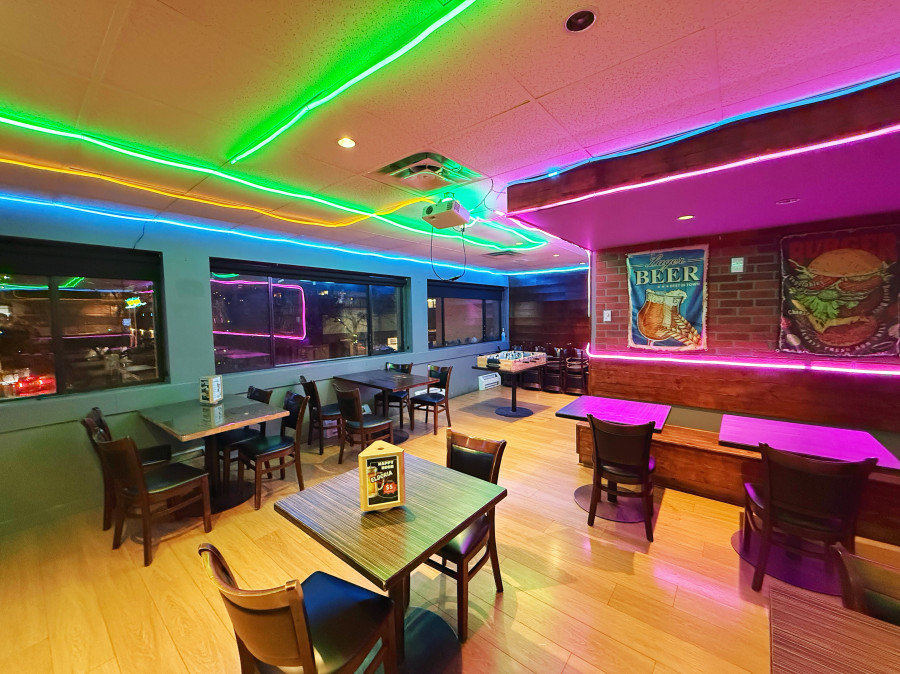
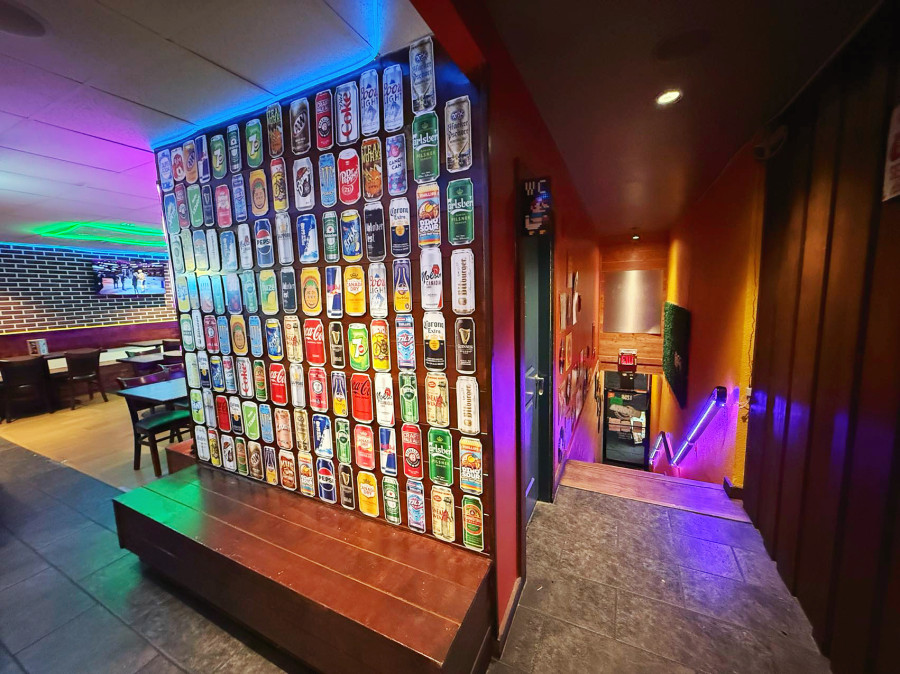
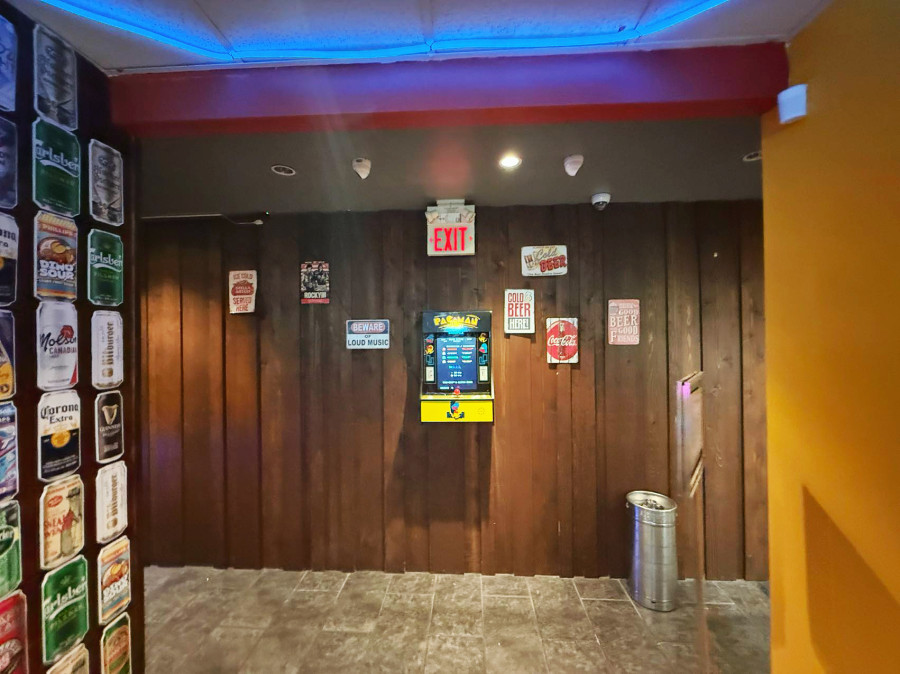
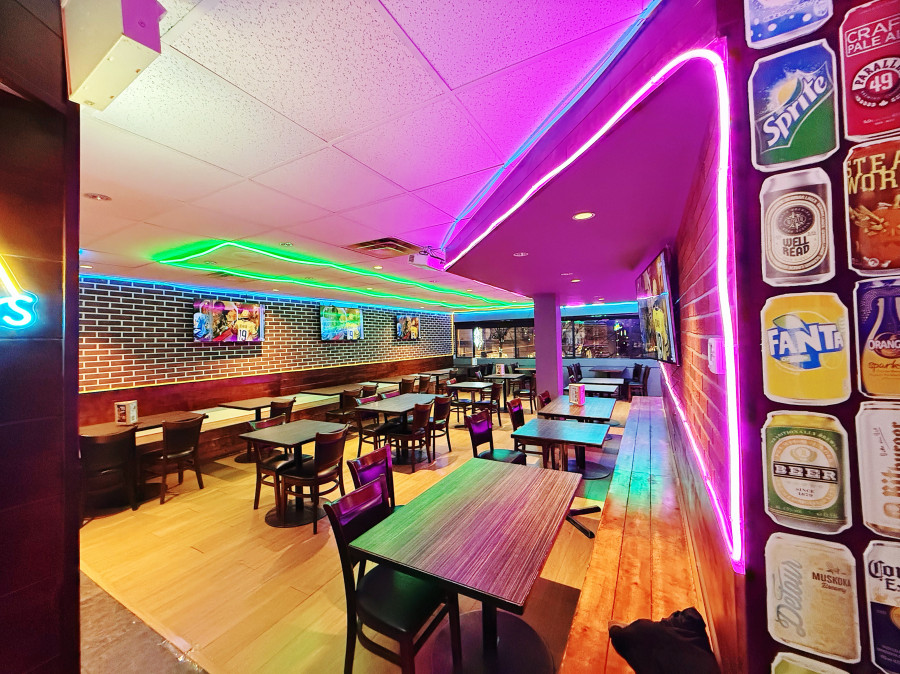
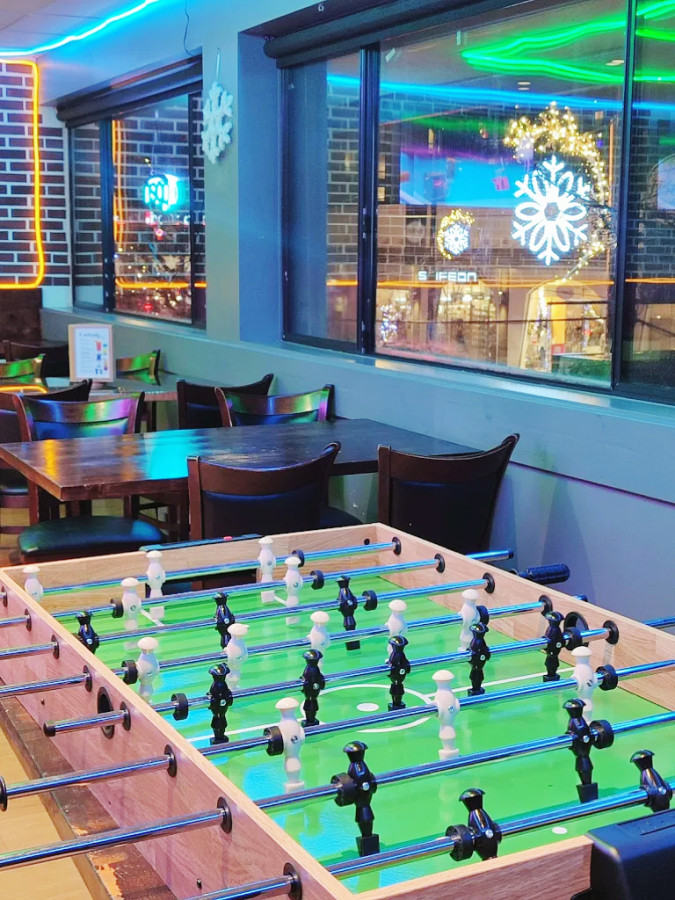
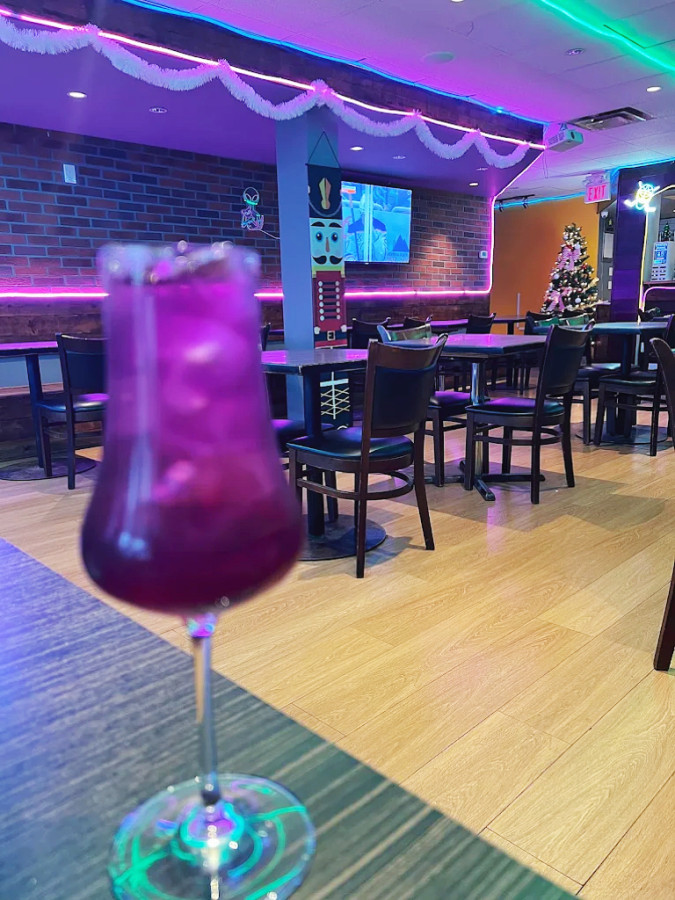
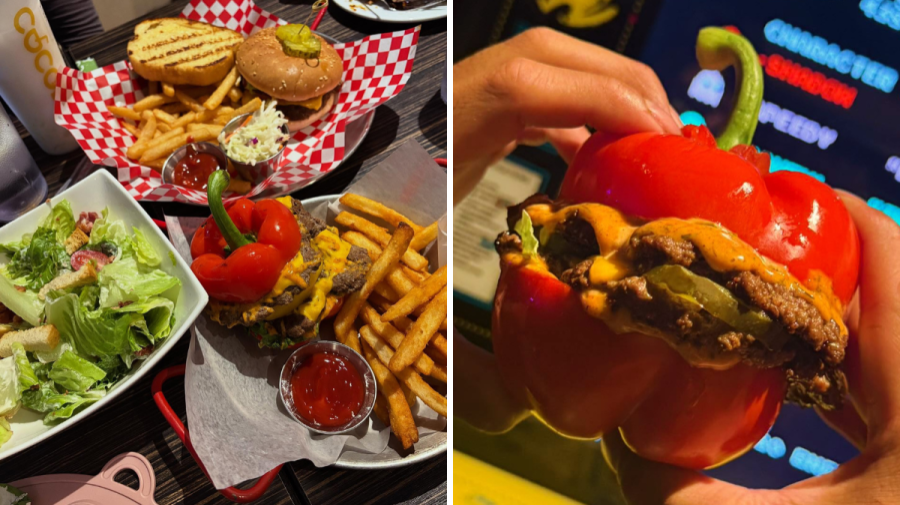
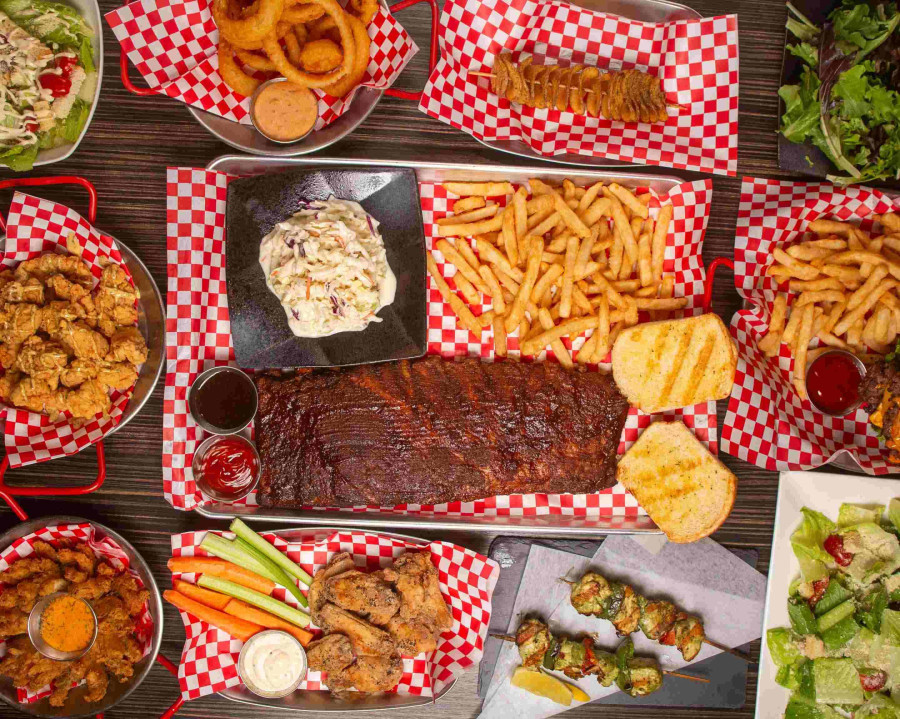
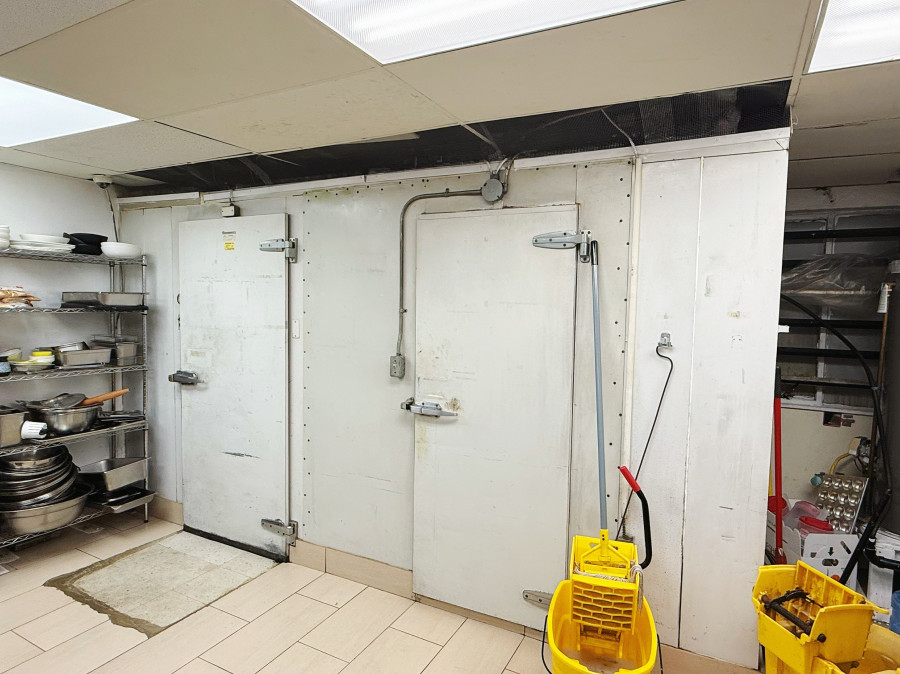
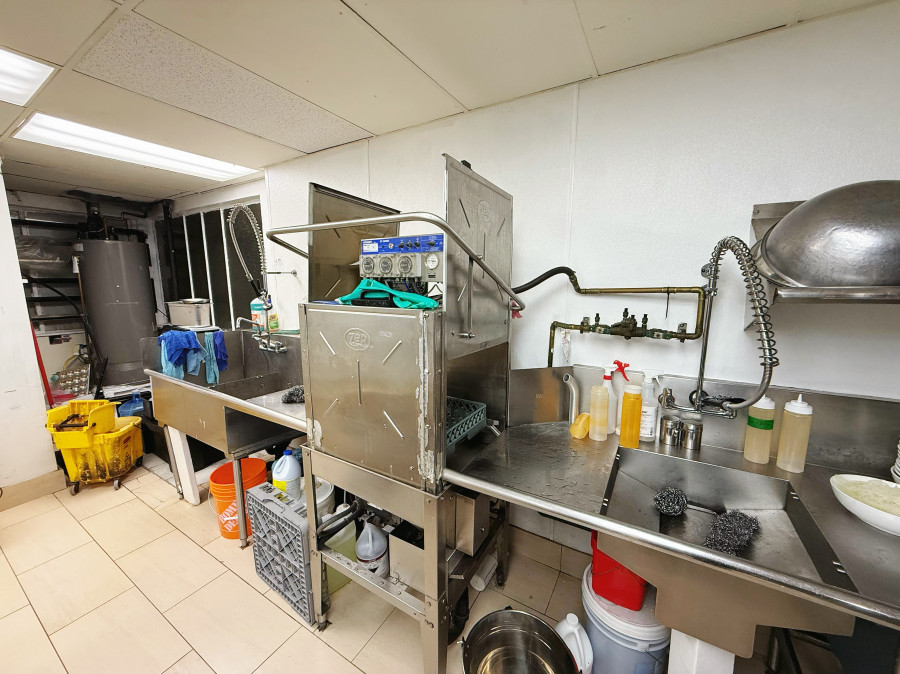
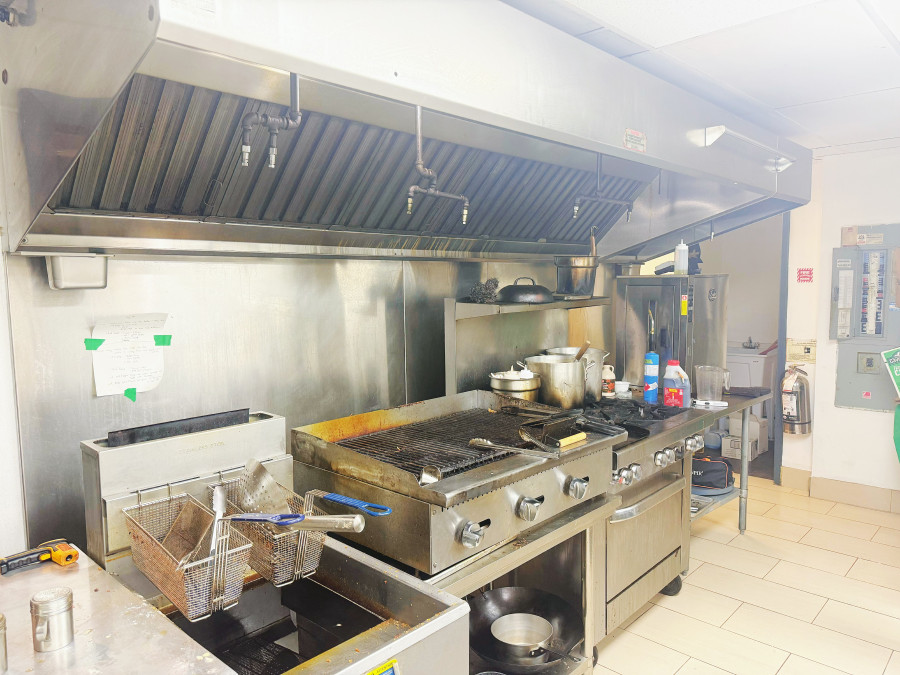
The premises are equipped with a full commercial kitchen, allowing for quick takeover and immediate operation, significantly reducing initial setup costs and preparation time. The interior offers a spacious dining area with ample seating and a flexible layout suitable for daily dine-in service, private events, group gatherings, and corporate functions. The space also provides excellent versatility and can be adapted to accommodate various restaurant concepts or cuisines.
*Please contact the listing agent for more information today!
地图周边
社区结构2021年人口统计数据
人口统计
| 总计 | 男性 | 女性 | |
| 2021年该地区人口数量 | 3,370 | ... | ... |
|---|---|---|---|
| 2016年该地区人口数量 | 2,979 | ... | ... |
| 2006年到2011年该地区人口变化率 | 13.1 | ... | ... |
| 个人住宅数量 | 2,108 | ... | ... |
| 正常使用的个人住宅数量 | 1,803 | ... | ... |
| 每平方公里人口密度 | 26,266.6 | ... | ... |
| 该地区土地面积(平方公里) | 0.13 | ... | ... |
房价租金统计
| 总计 | 男性 | 女性 | |
| 平均房价 ($) | 1,228,000 | ... | ... |
|---|---|---|---|
| 养房开销(包括税,贷款,水电煤,管理费) ($) | 2,160 | ... | ... |
| 有房屋贷款的居民比例 (%) | 51.2 | ... | ... |
| 租房开销(包括租金,水电煤,服务费) ($) | 2,100 | ... | ... |
| 独立房 | 0 | ... | ... |
| 公寓(5层以上大楼) | 1,735 | ... | ... |
| 半独立屋 | 0 | ... | ... |
| 排屋 | 10 | ... | ... |
| Duplex里的公寓 | 0 | ... | ... |
| 公寓(4层以下大楼) | 50 | ... | ... |
| 其他独立住宅 | 0 | ... | ... |
| 临时房 | 0 | ... | ... |
收入统计
| 总计 | 男性 | 女性 | |
| 2020年家庭平均收入 | 161,600 | ... | ... |
|---|---|---|---|
| 2020年家庭平均税后收入 | 123,200 | ... | ... |
| 家庭平均人口 | 2.4 | ... | ... |
| 2020年无子女的家庭平均收入 | 199,000 | ... | ... |
| 2020年无子女的家庭平均税后收入 | 146,500 | ... | ... |
| 无子女的家庭平均人口 | 2.0 | ... | ... |
| 2020年有子女家庭平均收入 | 135,000 | ... | ... |
| 2020年有子女家庭平均税后收入 | 111,000 | ... | ... |
| 有子女家庭平均人口 | 3.5 | ... | ... |
| 2020年单亲家庭平均收入 | 72,000 | ... | ... |
| 2020年单亲家庭平均税后收入 | 61,000 | ... | ... |
| 单亲家庭平均人口 | 2.3 | ... | ... |
语言统计
| 总计 | 男性 | 女性 | |
| 只说英语的人数 | 2,955 | 1,530 | 1,425 |
|---|---|---|---|
| 只说法语的人数 | 0 | 0 | 0 |
| 可以说英法语的人数 | 315 | 155 | 150 |
| 不懂法语和英语的人数 | 105 | 45 | 60 |
族裔统计
| 总计 | 男性 | 女性 | |
| 南亚人 | 235 | 125 | 110 |
|---|---|---|---|
| 中国人 | 420 | 195 | 220 |
| 黑人 | 10 | 10 | 0 |
| 菲律宾人 | 60 | 20 | 35 |
| 阿拉伯人 | 50 | 15 | 35 |
| 拉丁美洲人 | 130 | 60 | 70 |
| 东南亚人 | 65 | 20 | 45 |
| 西亚人 | 345 | 175 | 175 |
| 韩国人 | 245 | 90 | 160 |
| 日本人 | 90 | 30 | 55 |
| 其他民族 | 35 | 25 | 15 |
| 属于多个民族的后裔 | 110 | 50 | 65 |
| 非少数民族 | 1,210 | 695 | 520 |
职业统计
| 总计 | 男性 | 女性 | |
| 立法和高级管理职位 | 50 | 30 | 20 |
|---|---|---|---|
| 商业,金融和行政 | 490 | 220 | 275 |
| 自然和应用科学领域工作 | 350 | 245 | 105 |
| 卫生保健行业 | 70 | 20 | 50 |
| 教育,法律,社区和政府工作 | 220 | 80 | 140 |
| 艺术,休闲,文化和体育行业 | 160 | 90 | 70 |
| 销售和服务性行业 | 500 | 240 | 260 |
| 技术工人,运输业,操作工及相关行业 | 115 | 115 | 0 |
| 自然资源,农业及相关行业 | 0 | 0 | 0 |
| 加工行业和公共事业 | 10 | 10 | 0 |