
列治文黄金地段高人气餐厅出售(MLS#C8082576)
1231 8338 Capstan Way, Richmond, Vancouver, BC V6X 4B5 地图周边 | 社区结构
物件说明
- iU91编号 139833
- 发布人 地产经纪
特色说明
*仅限预约参观,请勿打扰工作人员*
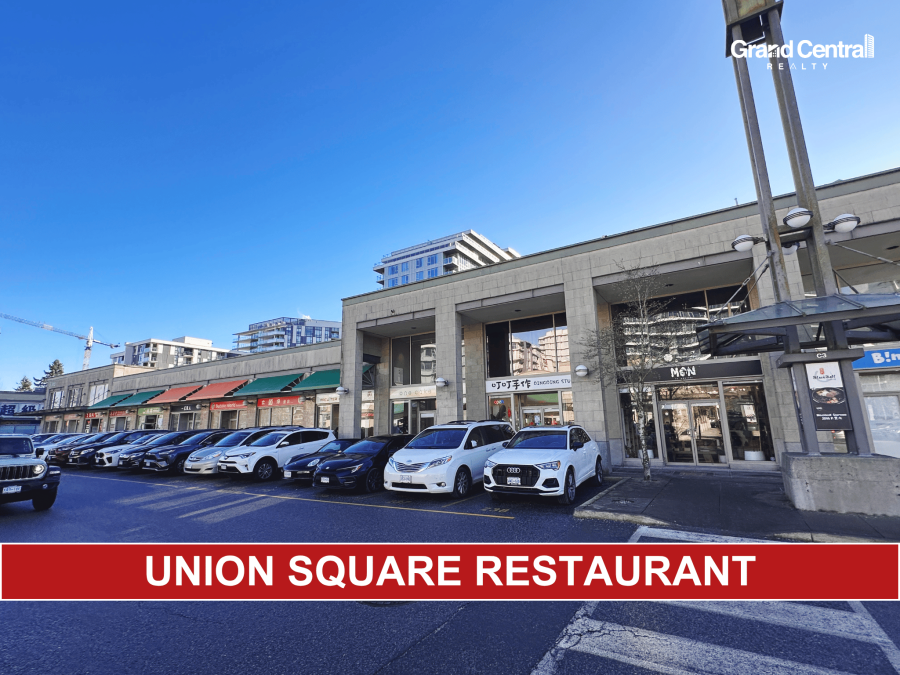
餐厅坐落于列治文繁华的新城市广场,地理位置优越,周边汇聚众多高密度住宅社区、知名餐饮品牌,步行至天车站。
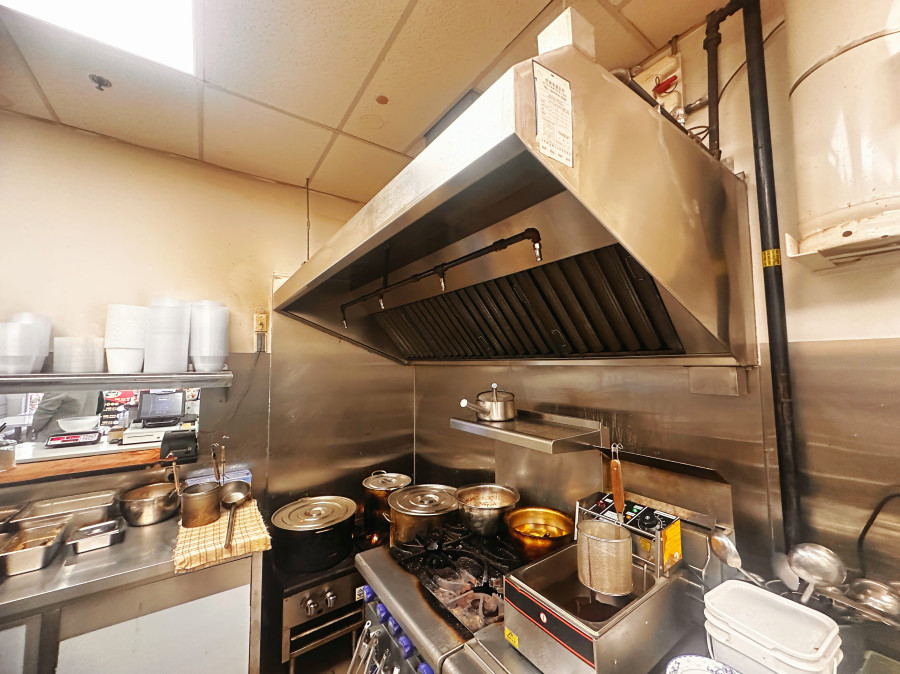
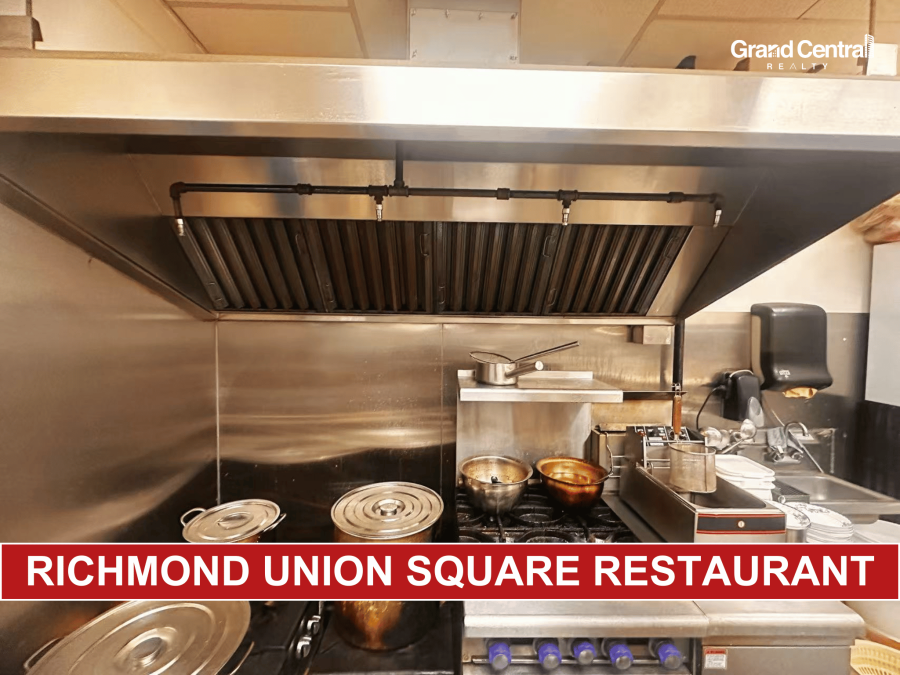
配备设施齐全的商业厨房及专业排风系统,同时设有充足的备餐空间及储物区域,能够满足不同餐饮经营需求。现有装修及设备完善,为新业主节省大量前期装修成本及筹备时间。
新城市广场交通便利,拥有充足的顾客停车位,周边人口密集,商业配套成熟,汇聚稳定的社区消费群体。广场内众多知名餐饮商家形成良好的餐饮聚集效应,有利于吸引周边居民及各地食客,为餐厅经营及未来发展创造有利条件。
机会难得,欢迎有实力的餐饮经营者及投资者咨询!
有意向者请联络代理经纪获得更多信息。
*Showing by appointment only, do not disturb staff.
Excellent opportunity to acquire a well-established restaurant in the highly desirable Union Square area of Richmond! Situated in one of Richmond's vibrant commercial and dining destinations, this restaurant enjoys a prime location surrounded by numerous residential developments, popular restaurants, shopping centres, and a thriving local community.
The restaurant features a spacious and welcoming dining area, a fully equipped commercial kitchen with an existing ventilation system, ample food preparation space, and well-organized storage areas. Its practical layout provides an excellent foundation for efficient daily operations and a variety of restaurant concepts.
Located in the bustling Union Square plaza, the business benefits from excellent accessibility, strong exposure, and ample customer parking. The surrounding high-density residential neighbourhood and established commercial environment offer tremendous potential to attract both loyal local customers and visitors from throughout Richmond.
Whether you are an experienced restaurant operator looking to expand or an entrepreneur seeking an established location, this is an outstanding opportunity to take advantage of existing restaurant infrastructure and establish your business in one of Richmond's sought-after dining destinations.
Please contact the listing agent for more information today!
地图周边
社区结构2021年人口统计数据
人口统计
| 总计 | 男性 | 女性 | |
| 2021年该地区人口数量 | 7,045 | ... | ... |
|---|---|---|---|
| 2016年该地区人口数量 | 3,566 | ... | ... |
| 2006年到2011年该地区人口变化率 | 97.6 | ... | ... |
| 个人住宅数量 | 3,931 | ... | ... |
| 正常使用的个人住宅数量 | 3,613 | ... | ... |
| 每平方公里人口密度 | 2,373.7 | ... | ... |
| 该地区土地面积(平方公里) | 2.97 | ... | ... |
房价租金统计
| 总计 | 男性 | 女性 | |
| 平均房价 ($) | 775,000 | ... | ... |
|---|---|---|---|
| 养房开销(包括税,贷款,水电煤,管理费) ($) | 1,712 | ... | ... |
| 有房屋贷款的居民比例 (%) | 58.8 | ... | ... |
| 租房开销(包括租金,水电煤,服务费) ($) | 1,806 | ... | ... |
| 独立房 | 145 | ... | ... |
| 公寓(5层以上大楼) | 2,645 | ... | ... |
| 半独立屋 | 15 | ... | ... |
| 排屋 | 280 | ... | ... |
| Duplex里的公寓 | 120 | ... | ... |
| 公寓(4层以下大楼) | 405 | ... | ... |
| 其他独立住宅 | 0 | ... | ... |
| 临时房 | 0 | ... | ... |
收入统计
| 总计 | 男性 | 女性 | |
| 2020年家庭平均收入 | 84,500 | ... | ... |
|---|---|---|---|
| 2020年家庭平均税后收入 | 74,200 | ... | ... |
| 家庭平均人口 | 2.5 | ... | ... |
| 2020年无子女的家庭平均收入 | 81,400 | ... | ... |
| 2020年无子女的家庭平均税后收入 | 71,000 | ... | ... |
| 无子女的家庭平均人口 | 2.0 | ... | ... |
| 2020年有子女家庭平均收入 | 101,200 | ... | ... |
| 2020年有子女家庭平均税后收入 | 89,600 | ... | ... |
| 有子女家庭平均人口 | 3.6 | ... | ... |
| 2020年单亲家庭平均收入 | 60,600 | ... | ... |
| 2020年单亲家庭平均税后收入 | 55,000 | ... | ... |
| 单亲家庭平均人口 | 2.4 | ... | ... |
语言统计
| 总计 | 男性 | 女性 | |
| 只说英语的人数 | 5,985 | 2,940 | 3,045 |
|---|---|---|---|
| 只说法语的人数 | 5 | 5 | 0 |
| 可以说英法语的人数 | 190 | 85 | 105 |
| 不懂法语和英语的人数 | 795 | 330 | 470 |
族裔统计
| 总计 | 男性 | 女性 | |
| 南亚人 | 195 | 105 | 90 |
|---|---|---|---|
| 中国人 | 4,840 | 2,250 | 2,585 |
| 黑人 | 35 | 15 | 15 |
| 菲律宾人 | 275 | 120 | 150 |
| 阿拉伯人 | 65 | 45 | 25 |
| 拉丁美洲人 | 90 | 40 | 45 |
| 东南亚人 | 135 | 70 | 65 |
| 西亚人 | 60 | 40 | 20 |
| 韩国人 | 120 | 55 | 60 |
| 日本人 | 115 | 40 | 70 |
| 其他民族 | 10 | 0 | 0 |
| 属于多个民族的后裔 | 220 | 110 | 110 |
| 非少数民族 | 810 | 440 | 365 |
职业统计
| 总计 | 男性 | 女性 | |
| 立法和高级管理职位 | 30 | 25 | 0 |
|---|---|---|---|
| 商业,金融和行政 | 935 | 350 | 590 |
| 自然和应用科学领域工作 | 440 | 325 | 115 |
| 卫生保健行业 | 165 | 60 | 105 |
| 教育,法律,社区和政府工作 | 235 | 95 | 140 |
| 艺术,休闲,文化和体育行业 | 190 | 75 | 110 |
| 销售和服务性行业 | 1,380 | 670 | 715 |
| 技术工人,运输业,操作工及相关行业 | 335 | 300 | 35 |
| 自然资源,农业及相关行业 | 10 | 10 | 0 |
| 加工行业和公共事业 | 115 | 70 | 40 |