
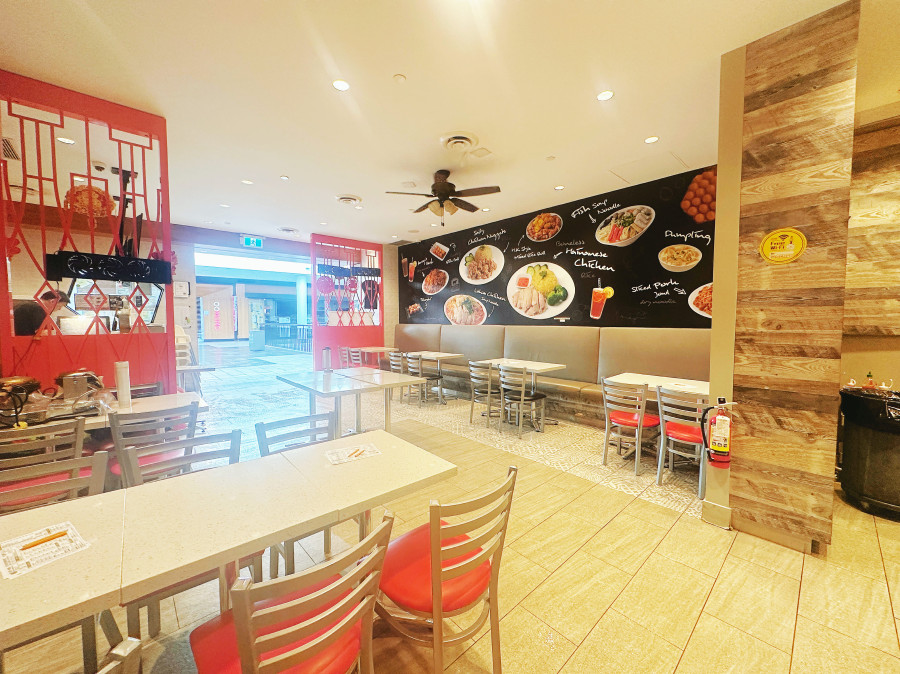
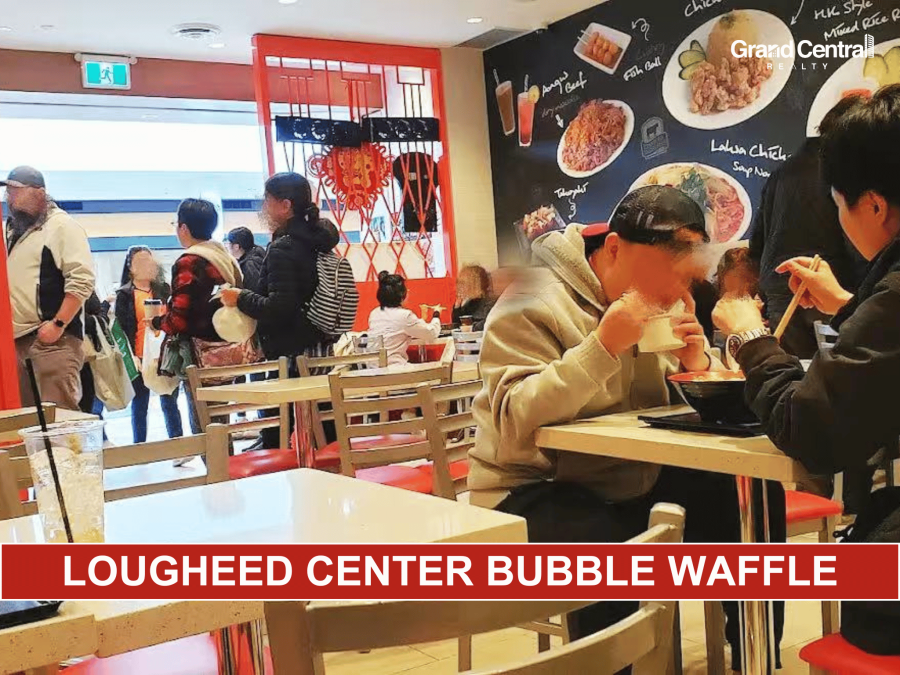
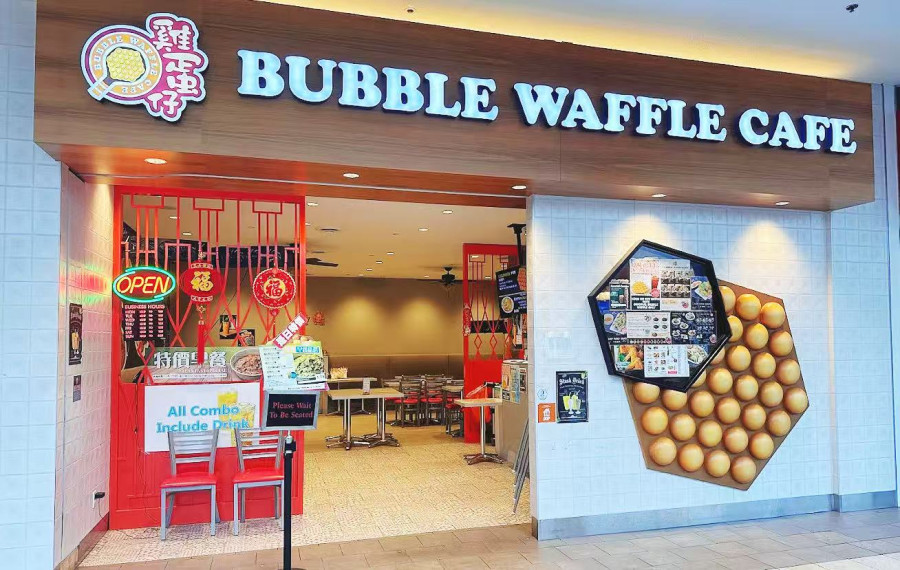
Lougheed Town Center美食鸡蛋仔店出售(MLS#C8071516)
Lougheed Town Center美食鸡蛋仔店出售(MLS#C8071516)
229-9855 Austin Road, Burnaby, Vancouver, BC V3J 1N4 地图周边 | 社区结构


售价 (加元)
$208,000
年营业额
--
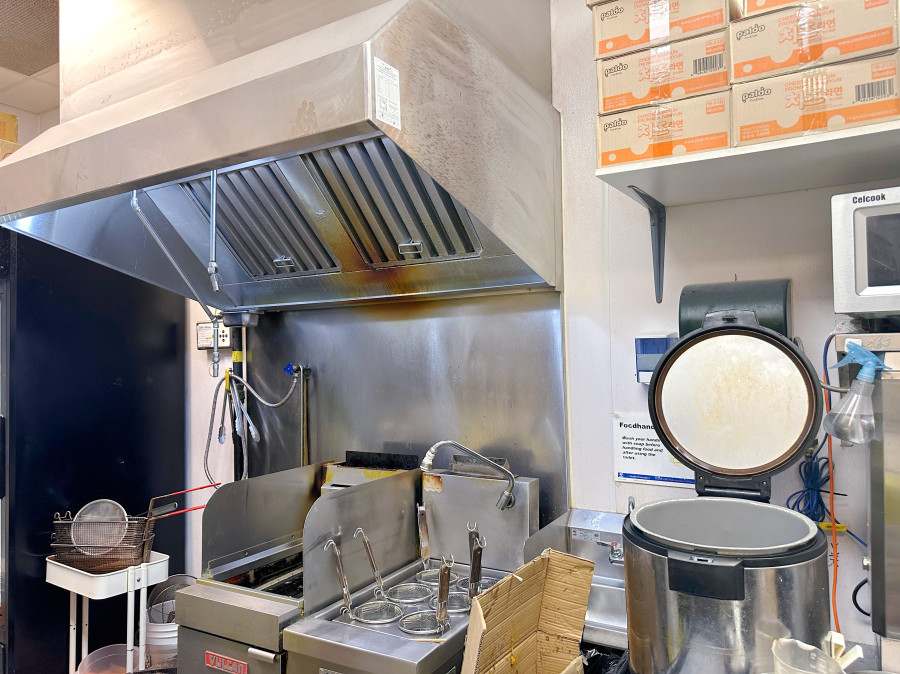
行业类型
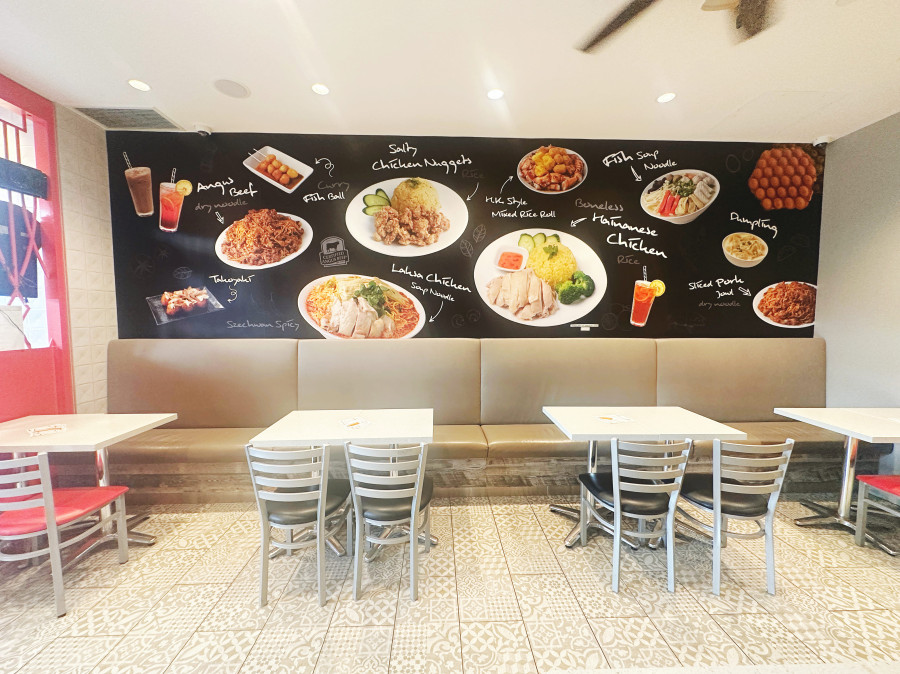
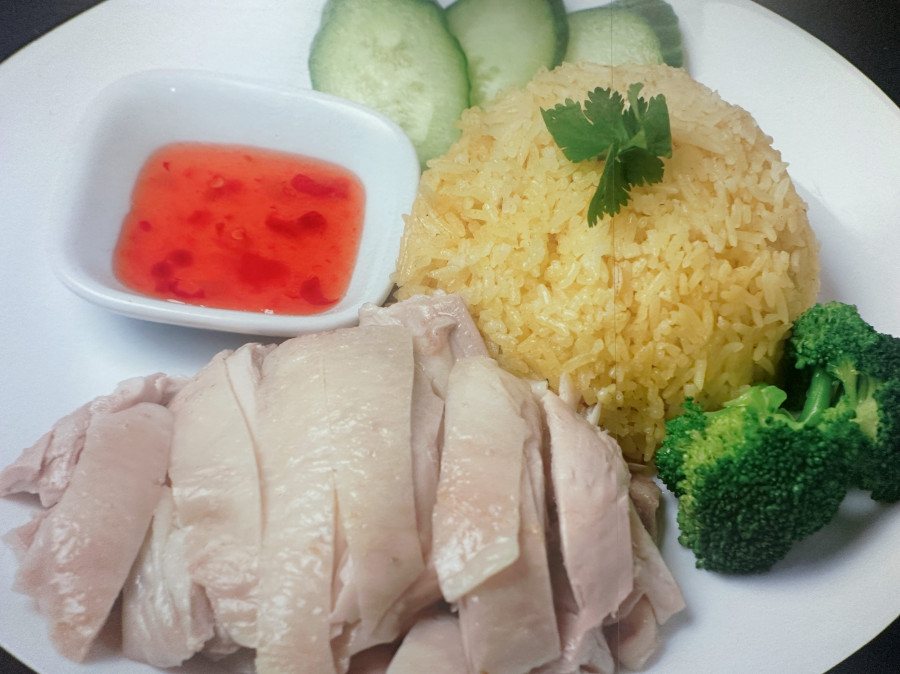
餐饮业
- 餐馆
物件说明
- iU91编号 142235
- 发布人 地产经纪